Free Player Retention Guide Get Now

As a game developer, you need to know how satisfied players are with the games you make and how much money those games are making. Gaming companies have access to enormous amounts of data. However, the raw numbers do not provide much insight into your game’s performance.
App analytics helps you turn raw data into meaningful insights. These are the 10 types of analytics you should be gathering.
Key Takeaways:
In 2022, Electronic Arts spent $961 million on marketing. While most publishers do not have such a large marketing budget, it is still one of their top expenses. Cost per install measures the average cost of acquiring one new player.
Calculate CPI by dividing your ad spend by your number of installs. The lower your CPI is, the better your marketing campaign is performing and the more profitable your game is likely to be.

K-factor is a type of app analytics that measures how many non-paying users your paying users refer to your game. A high K-factor reduces your user acquisition cost. For example, if it costs you $5 to generate a single install but that player convinces four players to install your game, your average cost for each install drops to $1.
The more engaged your users are, the more likely they are to log in to your game frequently.
Measuring daily active users helps you assess how engaged your players are by tracking the average number of users who open your app per day.
The higher this stat is, the more likely your game is to be financially successful. Additionally, tracking changes in this number can help you analyze the impact of new features, events, and other updates to your game.
Monthly active users is the number of players who open your game at least once during a month. Where DAU is useful for tracking how many active players you have, MAU helps you assess the total size of your player base, including players who only play the game occasionally.
The relationship between DAU and MAU is the stickiness ratio. Calculate the stickiness rate by dividing DAU by MAU and multiplying the result by 100.
For example, if you have 10,000 MAU and 1,000 DAU, your stickiness rate = 1,000/10,000*100 or 10%. This means that your average player opens your game on 10% of the days in a month. The higher your stickiness ratio is, the better your game is at enticing players to play every day and the better your retention and revenue will tend to be.
In app analytics, retention rate measures how well your game does at keeping players playing. The better your retention is, the higher your users’ average lifetime value will be because the longer players play your game, the more opportunities you have to get them to spend money.
To calculate retention, start by tracking a specific event, such as player logins, over a time period. If you want to track how many players log in the day after they log in for the first time, divide the number of players who logged in on day two by the number of players who logged in on day one, and multiply the result by 100.
For example, if 1,000 players logged in for the first time and 300 of them logged in again the next day, your retention rate would be 300/1,000*100 or 30%. You can use this number as a baseline to assess how changes to various aspects of your game impact your retention rate.

Your churn rate measures the rate at which players uninstall your app within a specific number of days from the date they installed the game. To calculate it, subtract your retention rate from 100.
Analyzing the change in churn rates after you make changes to your game or players encounter specific events, such as an offer to make an in-game purchase or a difficult level, can help you determine why players stop playing your game and what you can do to keep them playing.
Average revenue per daily active user (ARPDAU) helps you assess how much money your active users spend every day. This statistic is important for determining how well your monetization strategy is working.
To calculate ARPDAU, divide your daily revenue by your DAU. For example, if your game generates $10,000 in revenue per day and your DAU is 1,000, your average active player is spending $10 each day they play your game.
Once you establish your baseline ARPDAU, you can analyze changes in this statistic to assess how marketing campaigns, new features, and other changes to your game impact revenue.
With app analytics, time to first purchase refers to how long it takes the average user to make a purchase for the first time. This metric helps you determine the best placement for in-app purchase offers. Additionally, if it is taking too long to get players to spend money, you may need to adjust your monetization strategy.
Lifetime value measures how much revenue a player generates during the entire time they play your game. Calculate LTV by multiplying the number of days of engagement by the average amount players spend per day.
LTV helps you determine the monetary value of attracting specific types of players and the overall revenue potential for your game. It is also an indicator of how much you can spend on new player acquisition while remaining profitable.
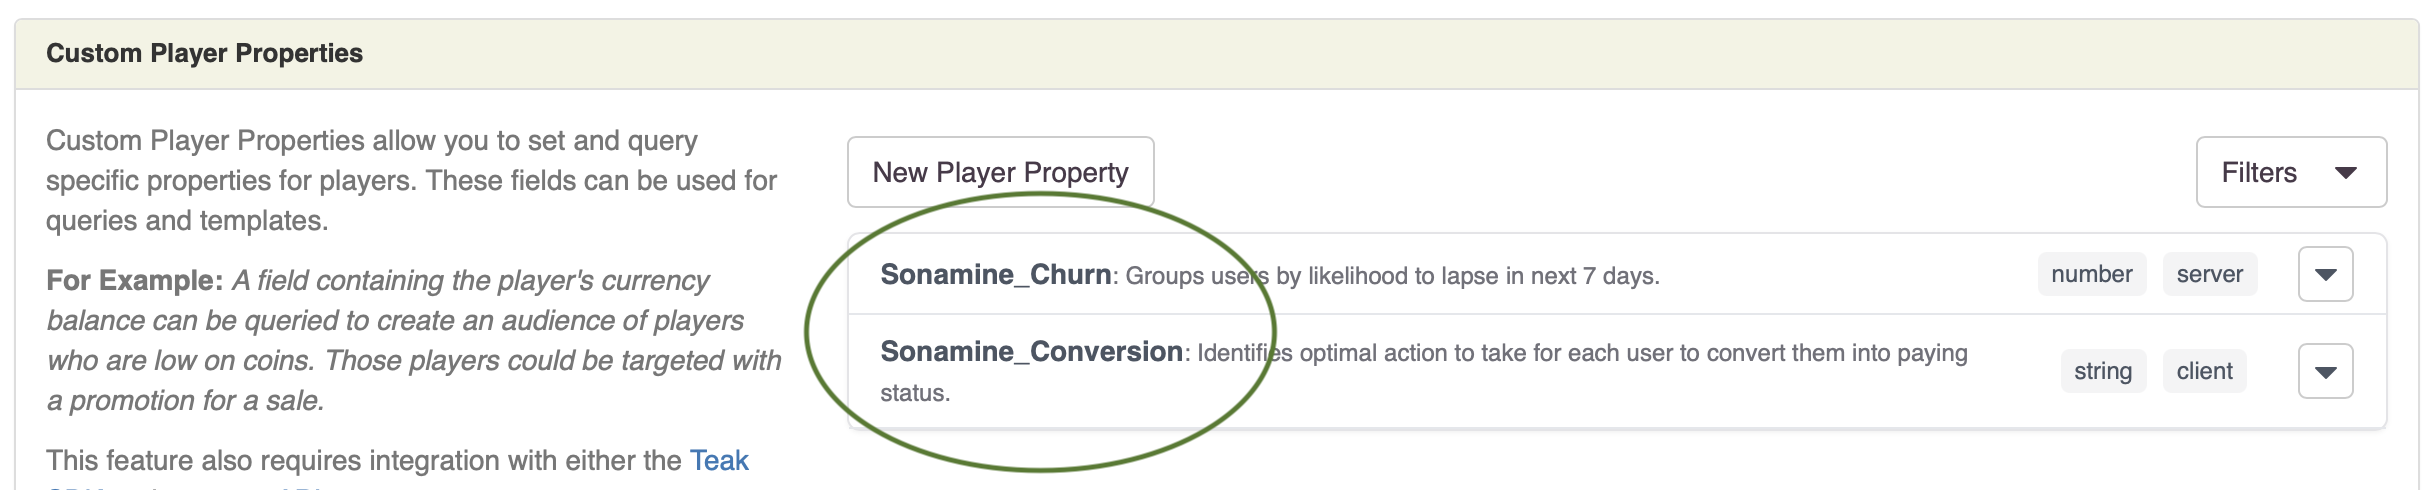
For a limited time until December 2025, Sonamine is offering a 60 day money back guarantee to OneSignal customers. Come experience the ease and simplicity of the First Time Spender Nudge package and watch your conversions soar.
For a limited time until December 2025, Sonamine is offering a 60 day money back guarantee to OneSignal customers. Come experience the ease and simplicity of the First Time Spender Nudge package and watch your conversions soar.